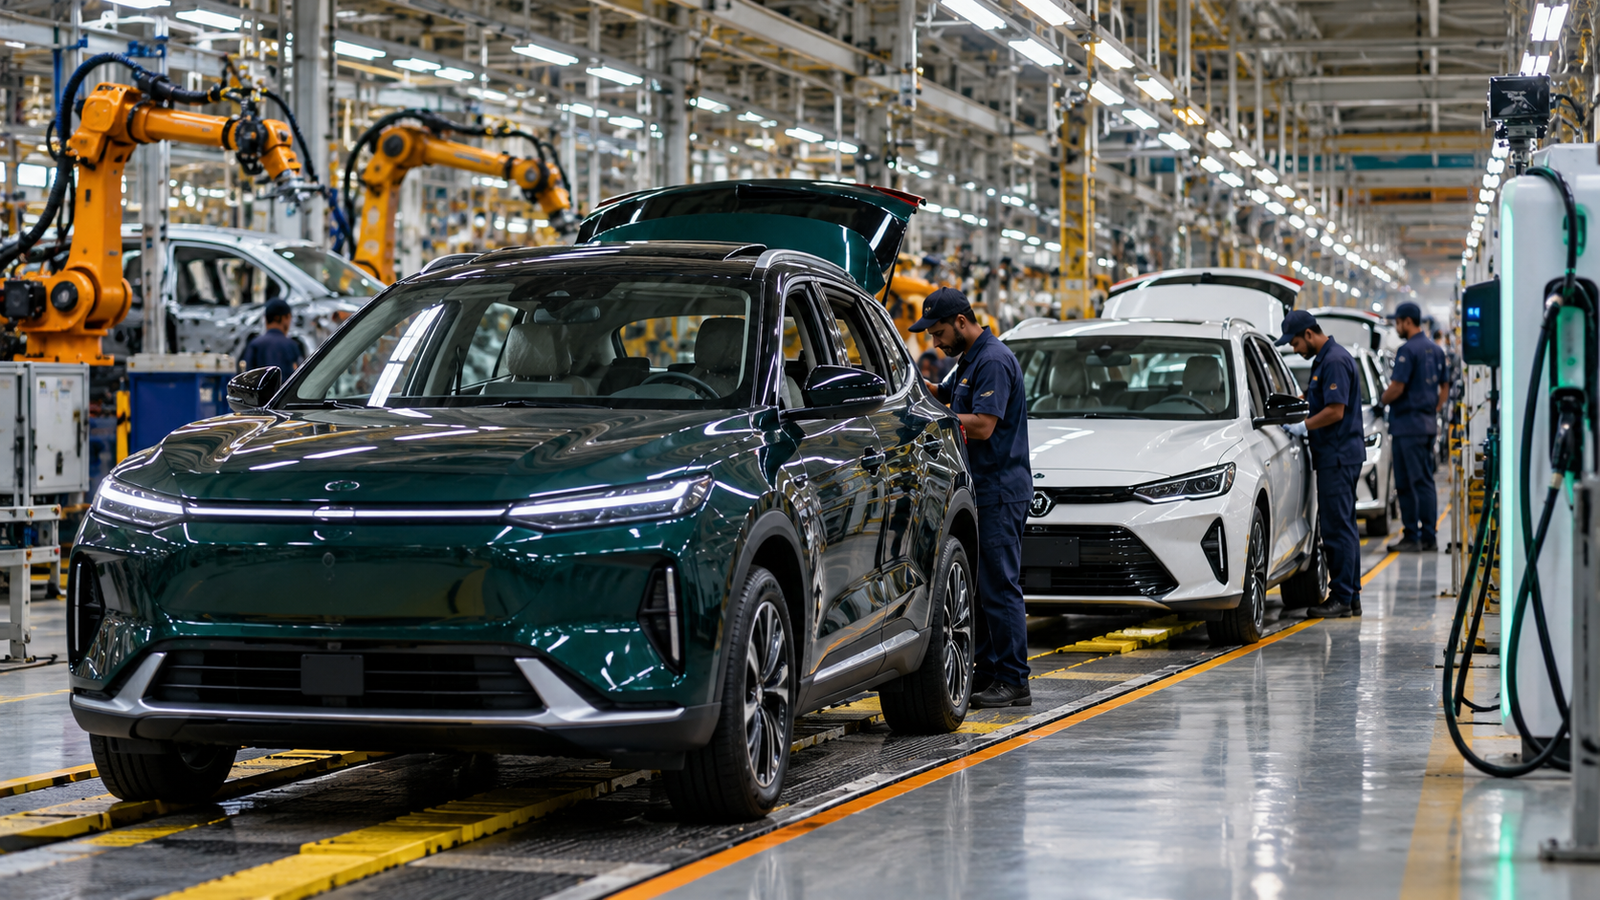
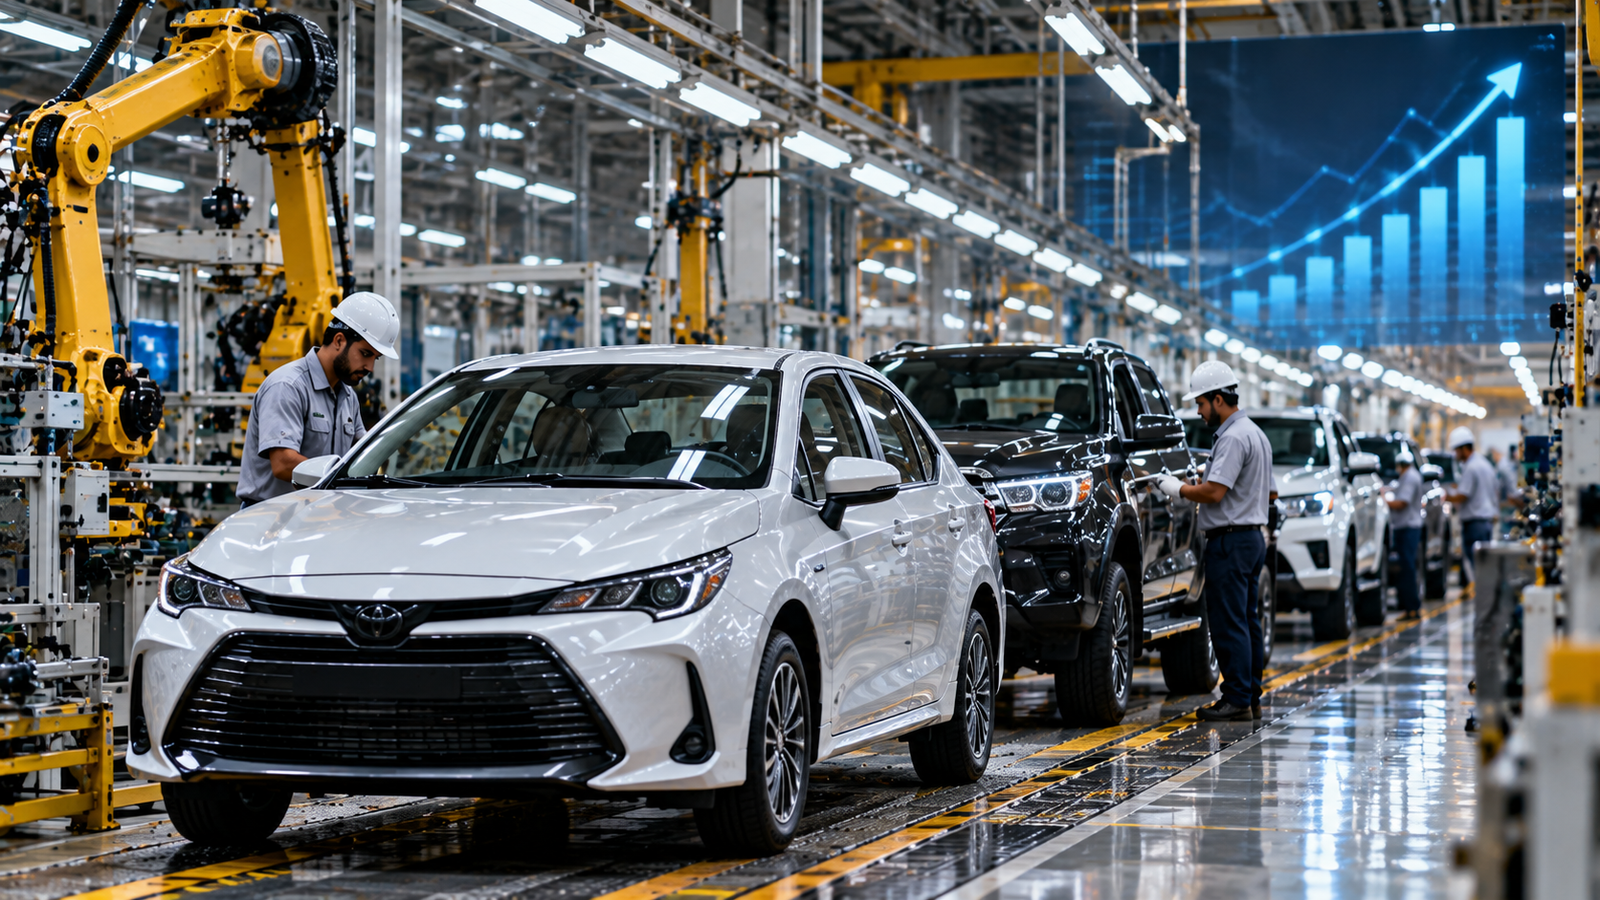
Toyota Indus Motor profit rose nearly 10% to Rs7.384 billion in the July–September 2026 quarter, according to the company’s Q1 FY2027 financial results. The Pakistani assembler earned Rs6.719 billion in the corresponding quarter a year earlier. The company reported revenue of Rs74.015 billion, compared with Rs61.738 billion in the previous year’s comparable quarter, while earnings per share increased to Rs93.95. The board announced a first interim cash dividend of Rs56 per share. Disclosures published through the Pakistan Stock Exchange on October 28 and company statements reported on October 29 link the performance to recovering demand, higher vehicle sales, localization and cost management. However, rising costs and pressure on operating margins mean the figures require more than a headline-level interpretation.
Toyota Indus Motor Profit: Q1 FY2027 Key Facts
Company: Indus Motor Company Limited (PSX: INDU).
Financial period: July 1 to September 30, 2026.
Exchange announcement: October 28, 2026.
Publication date of this article: October 29, 2026.
Revenue: Rs74.015 billion; prior-year comparison Rs61.738 billion.
Revenue growth: Approximately 19.9% year on year.
Profit after tax: Rs7.384 billion; prior-year Rs6.719 billion.
Net profit growth: Approximately 9.9% year on year.
Basic and diluted EPS: Rs93.95; prior-year Rs85.49.
Gross profit: Rs11.313 billion; prior-year Rs10.541 billion.
First interim cash dividend: Rs56 per ordinary share.
Reported company vehicle sales: 13,380 units, up approximately 34% year on year.
Vehicle-volume discrepancy: One analytical competitor report cites 13,260 units, so the company-reported figure is identified explicitly.
Gross margin: About 15.3%, compared with approximately 17.1% a year ago.
Financial reporting status: Unaudited quarterly results.
Official company filing reference: Pakistan Stock Exchange, INDU announcement dated October 28.
What Did Indus Motor Announce?
Indus Motor Company issued financial results for the three months ending September 30, 2026, on October 28. The figures published on the Pakistan Stock Exchange’s INDU company page show higher sales, higher net profit and stronger earnings per share compared with the same period a year earlier. The board also announced a first interim cash dividend. The company’s subsequent public comments described improving domestic demand, alongside challenges from used-vehicle imports and uncertainty around long-term automotive policy. These are company observations about the trading environment, not evidence that every new car model has become less expensive or that all domestic assemblers are growing at the same rate.
How Much Did Toyota Indus Motor Profit Increase?
Profit after tax increased from Rs6.719 billion to Rs7.384 billion. The increase of approximately Rs665 million represents growth of about 9.9%. In rounded headlines, this becomes a 10% rise in quarterly profit. Earnings per share similarly increased from Rs85.49 to Rs93.95. These are reported accounting profits after tax, not cash balances or total sales proceeds. Comparing the same quarter across years is useful because automobile demand can vary seasonally. A single quarter also cannot establish whether full-year profits will rise at the same pace, particularly if exchange rates, import costs, financing conditions or vehicle demand change later.
Revenue Grows Faster Than Net Profit
While Toyota Indus Motor profit increased about 10%, the company’s net sales rose from Rs61.738 billion to Rs74.015 billion, an increase of about Rs12.277 billion or 19.9%. This is roughly double the percentage rate of net-profit growth. A rise in revenue is positive for business activity, but the difference between revenue growth and profit growth is worth examining: higher vehicle production can also bring increased raw-material costs, staffing needs, freight and other expenses. Business analysis should therefore consider margins as well as revenue. Indus Motor’s quarterly financial statements show that cost of sales grew faster than revenue, which put pressure on gross profitability despite the improvement in the total number of vehicles sold.
Toyota Vehicle Sales Rise 34%
Indus Motor’s company-based media statement, carried by Business Recorder and The News on October 29, says 13,380 vehicles were sold during the quarter, up 34% from the corresponding period a year ago. ProPakistani’s October 28 financial analysis instead listed 13,260 units, a difference of 120 vehicles. This article uses the 13,380 company-reported number and discloses the discrepancy rather than silently combining conflicting counts. Volume growth is important because more delivered vehicles can spread some fixed manufacturing costs over a larger production base. But the business effect also depends on the mix of sedans, SUVs and pickup trucks sold.
Which Toyota Models Supported Demand?
ProPakistani’s analysis reported stronger volumes in the Yaris, Corolla and Corolla Cross segment, with growth of around 43% year on year to 10,925 units in its cited breakdown. The same report listed approximately 2,335 Fortuner and Hilux vehicles, with more modest growth. These figures refer to that analytical source and should not be presented as a direct independent reconciliation of the company-reported total. More broadly, demand for widely used models can have an important influence on an assembler’s overall performance. However, improved unit sales do not automatically mean a particular model has become cheaper, more profitable or more available at every dealership.
Why Gross Margins Declined Despite Higher Sales
Gross profit increased from roughly Rs10.54 billion to Rs11.31 billion, but its rate of growth was lower than revenue growth. The resulting gross margin declined from about 17.1% to 15.3%, according to ProPakistani’s analysis. A gross margin measures the share of revenue left after the direct cost of goods sold, before many other operating and financing expenses. The reduced margin means the company retained a smaller proportion of each rupee of sales at that stage. Analysts associated the change partly with the sales mix moving toward sedans. A quarter can therefore produce higher absolute profit while still revealing pressure on underlying per-unit economics.
Cost of Sales and Operating Expenses
Financial reporting summarized by Mettis Global shows cost of sales rising by approximately 22.5% to Rs62.70 billion from Rs51.20 billion. This was faster than the roughly 19.9% increase in revenue. ProPakistani reported distribution expenses of around Rs723 million and administrative expenses of around Rs898 million, both higher year on year. The company attributed overall financial improvement to sales, localization, cost management and other income. The cost increase is not inherently evidence of inefficiency, because producing and distributing more vehicles generally requires more spending. Still, investors must examine whether revenue growth translates sustainably into profits.
How Other Income Supported Profitability
ProPakistani’s analysis put other income at approximately Rs3.22 billion, up about 11% year on year, while finance costs rose to around Rs204 million from Rs50 million. Other income may include investment-related returns and can influence the bottom line independently of the operating margin on vehicles. That distinction matters: a headline profit increase is not identical to a comparable improvement in factory operations. An investor assessing performance should examine the financial statement’s detailed income categories rather than assume the entire rise in profit resulted from better manufacturing margins. Changes in prevailing interest rates and investment balances may alter other income from one period to the next.
What Is the Rs56 Interim Dividend?
The board declared a first interim cash dividend of Rs56 per share for the quarter. A cash dividend is a distribution to eligible shareholders and is different from earnings per share. The prior corresponding first-quarter dividend was Rs51 per share, according to the company’s earnings coverage. An investor holding 100 qualifying shares would receive Rs5,600 in gross declared cash dividends before any applicable withholding tax and subject to entitlement rules. The company notice identifies a book-closure window of November 6–10, with eligibility tied to the relevant shareholder register and exchange settlement requirements. Shareholders should check the official notice and broker guidance for precise entitlement and payment details.
Why the Fiscal Year Is Called FY2027
Indus Motor uses a fiscal year that ends in June. Its first quarter of fiscal year 2027 therefore covers July, August and September of calendar year 2026. This can confuse readers who think FY2027 refers only to dates in 2027. The previous-year comparison is the July–September 2025 quarter, commonly called Q1 FY2026. In other words, the October 28, 2026 announcement reports results from a completed quarter in 2026. It is not a forecast for September 2027 and should not be mixed with annual figures for the full year ending June 2027.
What Toyota Indus Motor Profit Results Say About Pakistan’s Auto Market
Indus Motor’s improved sales are consistent with a broader recovery in the country’s locally assembled vehicle market. ProPakistani cited Pakistan Automotive Manufacturers Association data showing locally assembled passenger car and light commercial vehicle sales growing approximately 19.4% to 50,480 units during the quarter. This supports the picture of stronger demand but does not mean every vehicle category has recovered equally. Affordability, financing access and exchange-rate movements continue to shape consumers’ decisions. A 34% increase at one large assembler may also reflect company-specific product availability and market share, not solely growth in the size of the entire market.
Why Localization Matters for Vehicle Manufacturing
Localization describes greater domestic production or sourcing of components and materials used in vehicle assembly. For an automaker, it can help manage costs and strengthen local supplier relationships, although the extent and economics vary by component. Indus Motor pointed to increased localization as one factor in its performance. Domestic sourcing can also create opportunities for parts suppliers, engineering businesses and skilled workers. But claims about the number of jobs created or foreign exchange saved require separate statistics. It would be premature to convert the company’s broad localization statement into an unverified measure of national economic benefits.
Used-Car Imports Remain a Competitive Concern
Indus Motor management raised concerns about the misuse of the gift scheme for used-car imports. Chief Executive Ali Asghar Jamali argued that such imports can put pressure on local manufacturing, investment, employment and government revenues. These are the company’s stated views and should be attributed to management. Import policy also affects consumers who may prefer different prices, features or vehicle choices. A neutral article can explain the interests at stake without treating either local assemblers or importers as automatically correct. The company called for clear rules and enforcement, but any policy reform would need its own official notification and broader assessment.
What About Pakistan’s Upcoming Auto Policy?
Company management also emphasized uncertainty over a clear long-term automotive policy, arguing that unpredictable rules can complicate investment planning. Automakers must make substantial decisions about production capacity, tooling, parts, technology and dealer networks in advance. A consistent framework can influence investment confidence, though it does not guarantee profitability or lower prices. At the same time, policymakers must consider consumer choice, industrial development, competition and environmental objectives. The October 28 earnings disclosure is not itself a new government auto-policy announcement. Any proposed future tax, tariff or electric-vehicle reform should be covered separately when the official details are available.
Will Toyota Car Prices Fall After Higher Profits?
A profitable quarter does not automatically lead to lower retail prices. Vehicle prices depend on component costs, import duties, taxes, exchange rates, logistics, financing conditions and business decisions. Even when a manufacturer sells more cars, it may continue to face imported material costs or reduced profit margins. The latest results did not announce a verified new price reduction for Corolla, Yaris, Hilux or Fortuner. Mukhbir therefore should not convert the earnings headline into a consumer price claim. Buyers looking for an actual car price should consult the manufacturer’s latest authorized price list and dealership terms.
Impact on Investors and the Pakistan Stock Exchange
Indus Motor trades on the Pakistan Stock Exchange under the ticker INDU. Its reported EPS and dividend are relevant to shareholders, but an earnings increase does not by itself determine whether the stock is attractively valued. Market price reflects expectations about future sales, competition, taxation and capital allocation. An investor may examine valuation multiples, balance-sheet strength, dividend sustainability and the effect of company-specific risks before making a decision. No stock recommendation follows from the figures in this article. One strong quarter can help explain market interest, but future share-price movement remains uncertain.
Potential Risks for the Rest of FY2027
Indus Motor cited international oil prices, geopolitical uncertainty, elevated operating costs and exchange-rate volatility among risks to the outlook. Higher fuel costs can discourage vehicle use or purchases, while currency weakness can make imported components more expensive. Financing availability also matters because many households use installment plans to purchase cars. Increased used-car competition may shape demand in some categories. These factors do not mean the company’s earnings will inevitably decline; they are uncertainties management and investors must monitor. The company has expressed cautious optimism about demand while recognizing that difficult external conditions could change the result.
Why This Story Matters to Pakistani Consumers
Auto industry results provide information about whether domestic assemblers are selling more cars, sustaining production and generating profits. That can matter for consumers indirectly through model availability, delivery lead times, parts supply and investment in technology. However, quarterly financial performance is not a consumer warranty, an official vehicle price notice or a new product launch. A reader interested in buying a car should separately examine reliability, running costs, current prices, after-sales service and financing terms. Earnings data is best used to understand the industry’s direction rather than as a substitute for vehicle-buying research.
Why Global Investors May Follow Pakistan’s Auto Sector
Pakistan’s vehicle market is influenced by imported components, household purchasing power, interest rates and government industrial policy. Foreign suppliers and investors monitor such markets to evaluate production potential and demand recovery. A higher-volume quarter at an established Toyota assembler offers one observation about Pakistan’s consumer market, but it cannot be generalized to every emerging economy. Companies differ in manufacturing scale, localization and regulatory exposure. For international readers, the broader lesson is that improved sales can coincide with pressure on profit margins, and that financial performance should be evaluated alongside policy, competition and macroeconomic risks.
What Should Readers Watch Next?
Future disclosures will show whether Indus Motor maintains higher vehicle volumes, protects margins and delivers returns on capital across the remainder of FY2027. Readers should monitor Pakistan Automotive Manufacturers Association sales data, updated financial statements, exchange-rate changes and any official auto-policy notification. The declared dividend’s entitlement and payment details can be checked through PSX and the company. Analysts will also watch how used-car imports and local production interact. No future vehicle sales number, new Toyota model launch or government decision is implied to be confirmed by this quarter’s financial report.
Conclusion
Toyota Indus Motor profit reached Rs7.384 billion in July–September 2026, alongside Rs74.015 billion in revenue and EPS of Rs93.95. The company also declared a first interim dividend of Rs56 per share, while company-based reporting described a 34% increase in vehicle sales. Higher revenue reflects improving demand, but slower gross-profit growth and rising costs show why financial performance should be judged beyond headline percentages. Used-car import competition and policy uncertainty remain concerns raised by management. These are verified financial developments, not an announcement that Toyota car prices have changed or a guarantee of future growth.
Frequently Asked Questions
What was Indus Motor’s profit in Q1 FY2027?
Indus Motor reported Rs7.384 billion in profit after tax for the quarter ended September 30, 2026.
How much did Indus Motor’s quarterly profit grow?
Profit rose approximately 9.9% year on year from Rs6.719 billion.
What revenue did Toyota Indus Motor report?
Revenue was Rs74.015 billion, up from Rs61.738 billion in the corresponding quarter a year earlier.
How many vehicles did Indus Motor sell?
Company-based October 29 reporting stated 13,380 vehicles, up 34%; one independent analysis listed 13,260 units, a disclosed reporting discrepancy.
What was Indus Motor’s earnings per share?
Basic and diluted EPS was Rs93.95, compared with Rs85.49 a year earlier.
What dividend did the company announce?
Its board announced a first interim cash dividend of Rs56 per share.
Does higher profit mean Toyota cars are getting cheaper?
No. The financial results did not announce a retail price reduction, and vehicle prices depend on several separate factors.
What are the biggest risks to the company outlook?
Management cited used-vehicle imports, policy uncertainty, energy costs, operating expenses and possible exchange-rate volatility.
About The Author